Analysis of the Surrey, October 10,2008 4:30 pm imagesThis series of photographs provided a
good opportunity for analysis for several reasons.
1. There were many photographs of the
object, 17 in total. (Images #79 to #96)
2. There were plenty of foreground objects in most of the images
3. The photographer remained stationary while taking the photographs
from a parked vehicle out of his driver-side window
This allowed the tracing of the path
of the object through the sky using the wires as reference points. Each
photograph was identified with a date and time of the photograph to the
nearest second. This allowed for the determination of the angular speed
of the object.
Figure 1 shows a photograph taken several months later
that was used to provide a reference for the trajectory determined from
the individual UFO images. Trajectory points from images 79 to 87 could
be determined relatively accurately since small visible imperfections in
the wires could be used to determine both the x and y coordinates along
the wires. Although wires were visible in images 88 to 92 only the
location of the UFO in the relative perpendicular direction from the
wires could be determined. This was because in real space (i.e. not in
the images) the six wires are parallel. The blue lines were drawn in
Figure 1 to give a line of possible locations of the UFO in images 88 to
92.
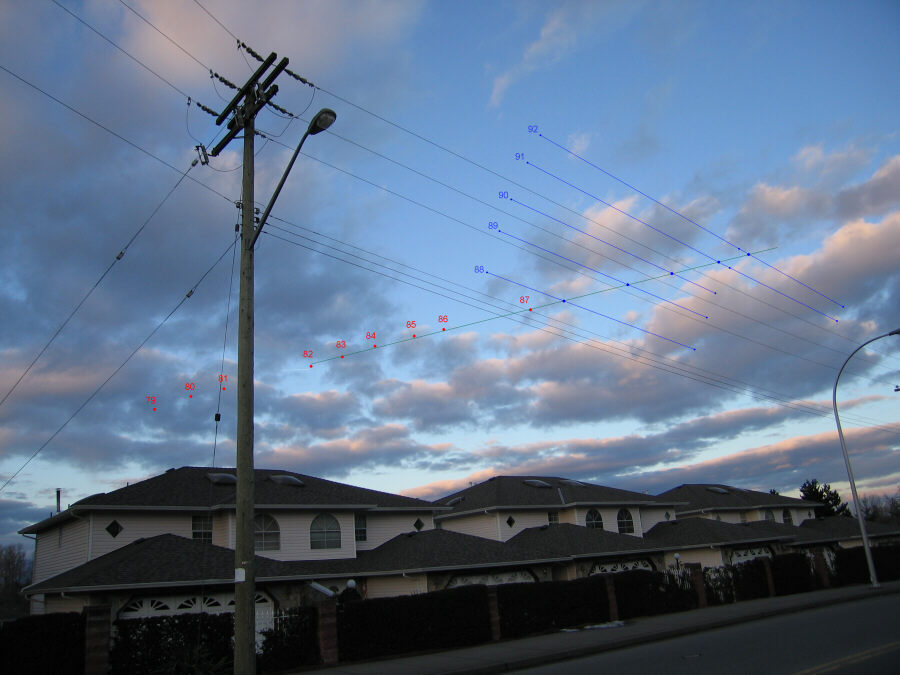
Figure 1. Photograph taken several months
later that was used to provide a reference for the trajectory determined
from the individual UFO images.
It is notable in Figure 1 that the reliable points 79
to 87 shown as red dotes are along a straight line. If one extrapolates
this line to cross the possible UFO location lines from images 88 to 97
one can obtain hypothesized UFO locations for the latter images (larger
blue dotes) with the assumption that the UFO continued to travel along
this straight line. Although this is only an assumption at this point in
the analysis, we can look at the time that each image was taken to
determine if angular velocity (degrees of sky per second) remained
constant or if the object accelerated or decelerated between any sets of
images.
Figure 2a and b show the cumulative arc and elapsed
time respectively. Generally, it appears that the longer the elapsed
time between the photos the greater the arc traveled. There are some
discrepancies but these can be explained by time rounding error to the
nearest second, scaling errors from the photograph, and scale distortion
in different parts of the frame from the lens projection.
Figure 2a. Arc (degrees) in sky traveled
between photographs. b) Elapsed time from first photograph.
Figure 3 shows the arc traveled versus time for both
the deterministic and extrapolated trajectory. One can conclude from
this plot that the object changed little in velocity and direction from
Image #79 to Image #92 provided that the extrapolated portion of the
trajectory is correct. The angular velocity of the object may have slowed
down, which is indicated by gradual decrease in slope of the curve with
time. This would be consistent with an object travelling at a constant
velocity and moving further and further away from the the witness. It
would have been extremely coincidental that an object would have changed
both direction and speed at the precise time that reference points along
the wires in the images were no longer available. Therefore the blue
trajectory (Blue points in Figure 1) shows the most probable trajectory
that followed the red trajectory in the same figure.
Figure 3. Arc traveled versus time for
determined and extrapolated trajectory.
The slope between the points in Figure 3 establishes
angular velocity (degrees per second) of the object movement between
images. Allowing for measurement error it appears this velocity is a
smooth and slightly curved function consistent with an object traveling
through the sky in a straight line. One can calculate the object's
velocity or speed from its angular velocity if one knows the distance to
the object. We do not know the distance to the object but we can come up
with a relationship with what speeds would be associated with what
distances. Let's assume the distance is 1 kilometre, from that the speed
calculates to be 8 m/s or 28
km/hr (Images 90 to 92) to 13 m/s or 46 km/hr (Images 79 to 82). If the
object was 10 km away it would have been traveling 280 to 460 km/hr, and
if it was 500 metres away it would have been traveling 14 to 23 km/hr.
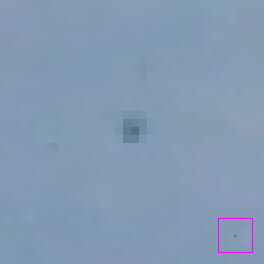
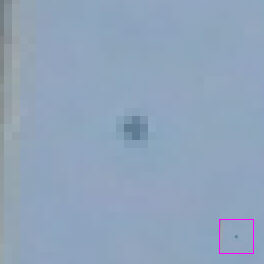
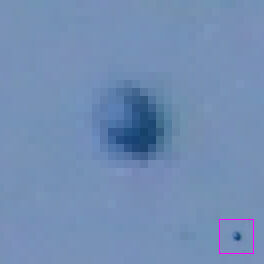
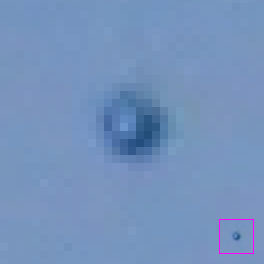
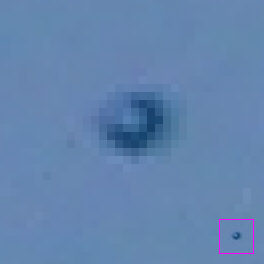
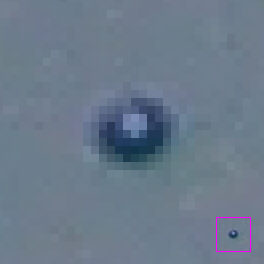
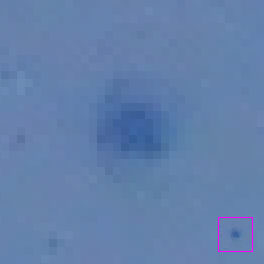
Figure 4 shows cropped and enlarged portions of the 17
images. The images were enlarged by 800% but the original pixel colours
and edges were maintained. The small insets (bordered by pink) are the
original 100% resolution versions. The first three images depict the UFO much
smaller since these three photos were not zoomed in (1X). A zoom level
change occurred with Frame#82 and #90, 3.53X and 4.8X respectively. All
zoom levels were within the optical zoom range of the camera.
 |
|
 |
|
 |
| #79, Zoom Level = 1x,
4:24:07 pm. |
|
#80, Zoom Level = 1x,
4:24:10 pm. |
|
#81, Zoom Level = 1x,
4:24:14 pm. |
| |
|
|
|
|
 |
|
 |
|
 |
| #82, Zoom Level = 3.53x,
4:24:23 pm. |
|
#83, Zoom Level = 3.53x,
4:24:26 pm. |
|
#84, Zoom Level = 3.53x,
4:24:31 pm. |
| |
|
|
|
|
 |
|
 |
|
 |
| #85, Zoom Level = 3.53x,
4:24:35 pm. |
|
#86, Zoom Level = 3.53x,
4:24:39 pm. |
|
#87, Zoom Level = 3.53x,
4:24:49 pm. |
| |
|
|
|
|
 |
|
 |
|
 |
| #88, Zoom Level = 3.53x,
4:24:53 pm. |
|
#89, Zoom Level = 3.53x,
4:25:02 pm. |
|
#90, Zoom Level = 4.80x,
4:25:08 pm. |
| |
|
|
|
|
 |
|
 |
|
 |
| #91, Zoom Level = 4.80x,
4:25:16 pm. |
|
#92, Zoom Level = 4.80x,
4:25:21 pm. |
|
#93, Zoom Level = 4.80x,
4:25:27 pm. |
| |
|
|
|
|
 |
|
This image # was a video
clip but the resolution was too low to make out the object |
|
 |
| #94, Zoom Level = 4.80x,
4:25:33 pm. |
|
#95 |
|
#96, Zoom Level = 4.80x,
4:26:27 |
| |
|
|
|
|
Figure 4. Magnified and cropped UFO images (by
800%), with the original pixel colours maintained.
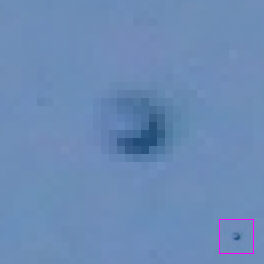
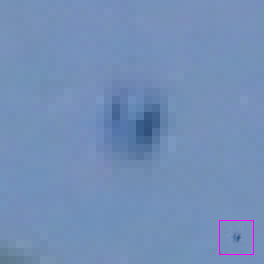
Images 82 to 92 in Figure 4 show that the UFO had a
bright coloured or reflective area. However, this area did not appear to
be consistently located on the UFO. For example, in Frame#90 the
brighter area is on the upper left, in Frame#91 it is on the left, in
Frame#92 it is on the upper left once again. This shows that the object
may had been tumbling or wobbling as it flew through the sky and also
that it was not perfectly round and had a preferentially reflective axis.
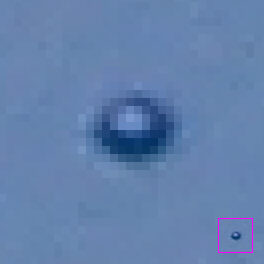
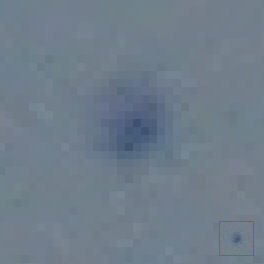
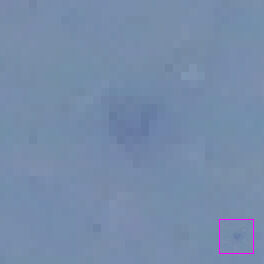
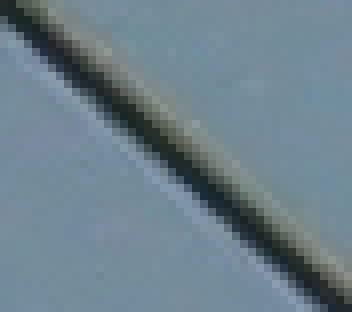
There is a sharp decrease in sharpness and contrast of
the object starting with Frame# 93 in Figure 4. This does not appear to
be a product of the object distance but something to do with the camera
since the wire in Frames #92 and #93 also shows this same change in
sharpness and contrast (Figure 5). It appears that perhaps that the
camera was having difficulty auto-focusing on the object for Frames #93,
94, and 96 (#95 was a movie file) since there were no other substantial
objects in the central portion of the photograph for the camera to focus
on. The wire in Frame#93 was in the lower left hand corner so the camera
would have excluded it as a subject for the auto-focus.
 |
|
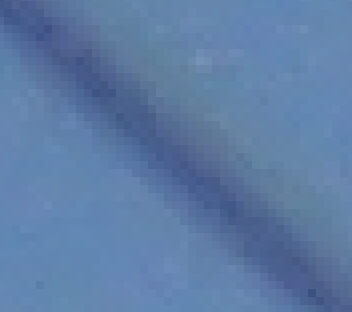 |
| Wire in #92, Zoom Level = 4.8x |
|
Wire in #93, Zoom Level = 4.8x |
Figure 5. Change in sharpness and contrast
from Frame #92 to #93 is evident in the wire as well as in the UFO in
Figure 4.
Next, one can examine the size of the UFO in the
images. The focal length of each image was recorded with the image
information.
From the focal length, the zoom levels (noted in Figure
4) could be determined by dividing the focal length of each image by the
focal length of the first image that was taken at 1 X zoom. This zoom
level is denoted as "Z".
Next the number of pixels "P" could be counted that
established the width of the UFO in each image.
In Frame#79 (which had a zoom level of 1) the degrees
of objects were measured in the field with an inclinometer. It was
established that the 1X zoom images exhibited 0.0149 degrees per pixel "Dp".
The angular size "AS" of the object in each Image
could thus be determined by:
AS = Dp x Z x P
Figure 6 shows the angular size of the object as a
function of the amount of time elapsed from the time of the first
photograph was taken. This shows that the object got smaller and smaller
at a constant rate.
Figure 6. Angular size of the object as it
changed with elapsed time.
What about the object's actual size? That cannot be
determined with certainty since we do not know the distance to the
object. However we can calculate a size for the object if we assume a
distance to the object. Let's assume it is once again 1 km. An angular
size for an object that takes up 0.045 degrees the size of the object
calculates out to be:
Size = 0.045 degrees x 1000 m x PI/180 degrees
(PI = 3.142), or 0.79 metres. If the object was 10 km away it would have
been 7.9 metres wide. If it was 500 m away it would have been 0.39
metres (1.3 feet) in wide.
Weather and Wind Direction
Meteorological conditions were obtained from Environment Canada. The
nearest weather station at the Vancouver Airport (22 km away) indicated
that the winds were out of the West Northwest that afternoon. These wind
speed measured at 10 metres above ground levels were recorded to be between 13 and 26 km/hr that afternoon.
Generally winds increase with elevation and decrease with ground
roughness (houses, larger buildings, trees, airports all have a
different roughness). The following website provides a tool how to
calculate wind speeds at higher elevations if measured at 10 metres for
various ground roughnesses.
http://www.windpower.org/en/tour/wres/calculat.htm
It appears from this website that a wind measured at an airport
at 10 metres (roughness = 0.5) is about equivalent to a wind speed at
150 metres above the ground over an urban area (roughness = 3). So we
can surmise the the wind speed was somewhere between 13 and 26 km/hr.
From earlier in the analysis the object would have had to have been
about 500 metres away and would have been about 0.4 m wide to fit the
criteria.
The
direction that the photographs were taken was North Northeast. The
object trajectory as presented by the series of photographs was left to
right in these images which is consistent with the wind direction
measured at the Vancouver Airport.
Conclusion
Due to the relatively small angular size of the object in the
photographs (up to to 11 pixels), it is impossible to conclusively
determine what this object was. The object was however consistent with a
small object (0.4 m) rising slowly and moving in a direction and speed
that was consistent with the local meteorological conditions at the time
provided it was 500 to perhaps as much as 1000 metres away. Its
trajectory and direction appeared to be constant from Image to Image.
If the object was much further away than a 1000 metres (say several kilometres),
it would have been inconsistent with a free floating/rising object floating
along with the wind speed and direction and would have been something
unconventional.
 RETURN TO DELTA PHOTOS
MAIN PAGE
RETURN TO DELTA PHOTOS
MAIN PAGE